

PODCAST: Markets under Pressure
April 16, 2026
Monthly Market Overview – May 2026
June 12, 2026PODCAST: Markets under Pressure
April 16, 2026Monthly Market Overview – May 2026
June 12, 2026NEWS
Monthly Market Overview
APRIL 2026 IN REVIEW
ECONOMIC AND MARKET OVERVIEW
April 2026 was dominated by the ongoing US–Israel–Iran conflict, energy market disruptions, and cautious monetary and fiscal recalibrations worldwide. Europe
tightened credit terms and faced energy volatility, while Asia moved to strengthen regional energy security, with the IMF revising global growth projections downward.
The Iran war remained the defining geopolitical event over the month. Iran leveraged control over the Strait of Hormuz, threatening global oil flows, while negotiations with the US stalled over uranium enrichment. A temporary ceasefire between Israel and Lebanon was extended, but missile strikes and naval blockades kept energy markets unsettled. Oil prices hovered above USD 110 per barrel, reinforcing fears of prolonged disruption. The oscillation between talks of ceasefires and renewed attacks created significant market volatility, with the VIX index rising and falling with each new piece of news, as well as driving considerable speculation.
The International Monetary Fund’s (IMF’s) April 2026 World Economic Outlook downgraded global growth to 3.1% for 2026 (from 3.3% in January), citing war-driven energy shocks, inflation pressures, and tighter financial conditions. Emerging markets were hit hardest, with growth forecasts cut to 3.9%. Risks remain skewed to the downside, with stagflation concerns rising in energy-importing economies.
April brought renewed strain across Europe’s energy and financial systems. Russian gas flows via TurkStream dropped sharply, compounding shortages already linked to
Middle East turmoil. The ECB’s latest lending survey showed banks tightening credit standards across households and firms, while demand weakened. At the same time, Brussels advanced a €90 billion support package for Ukraine and pushed reforms in customs and industrial policy-moves aimed at shoring up resilience and strategic
autonomy amid mounting external pressures.
In Asia, governments moved quickly to insulate themselves from global shocks. ASEAN nations accelerated ratification of a petroleum sharing agreement, underscoring regional coordination on energy security. Japan’s central bank reiterated its cautious stance, warning of oil driven inflation risks, while China directed banks to expand lending to stabilise growth. Together, these steps highlight the Far East’s dual focus: guarding against imported energy volatility while sustaining momentum in domestic demand.
South Africa’s economy reflected both resilience and strain: new vehicle sales hit their best April since 2013 despite rising fuel costs; the government cut the fuel levy to
cushion the impact on households; and nearly R900 billion in investment pledges were secured at the SA Investment Conference. Yet imported inflation from the Middle East conflict and tighter credit conditions clouded the recovery outlook.
Between March and April 2026, South Africa’s fuel prices rose sharply: petrol increased by a little over R3 per litre (around 12%), while diesel surged by R7.50 per litre on average (nearly 30%). These hikes were driven by global oil volatility linked to the US–Israel–Iran conflict and the closure of the Strait of Hormuz. According to the Fuels Industry Association of South Africa, South Africans use more than 24 billion litres of fuel every year (around 2.0 billion litres per month). Nearly 60% of this is diesel, with petrol making up about 40%. The reduction in the fuel levy helped cushion households and businesses, but it was not large enough to offset the sharp increase in international oil prices.
MARKET PERFORMANCE
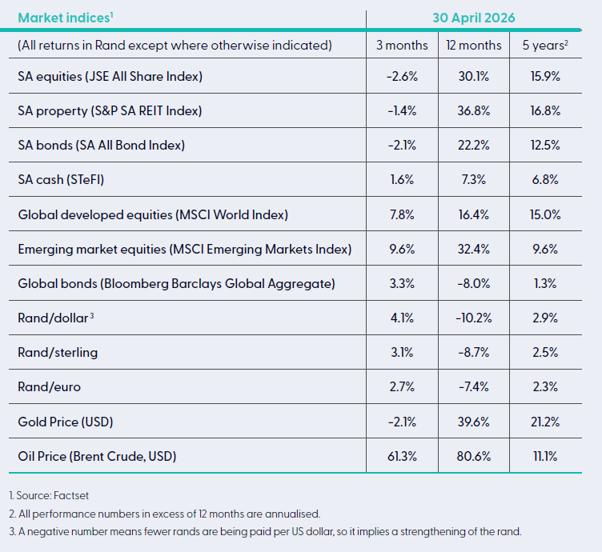
Global equity markets staged a powerful rebound in April 2026, led by US technology stocks, while Europe and Asia posted solid gains. South Africa lagged on a relative basis but still delivered modest positive returns.
US equities surged in April. The S&P 500 gained 10% in USD terms, its best monthly performance since 2020, while the NASDAQ jumped 16%, driven by AI-linked technology stocks and strong earnings. The FTSE 100 rose 2.3% in pound sterling during the month, supported by energy and banking shares. The Euro Stoxx 50 advanced 5.6% in euros, reversing March’s losses. Gains were broad-based, led by industrials and financials. The standout global market was Japan, with the Nikkei 225 soaring 17.2% (in Japanese yen) and hitting record highs above 59,000. Export strength and AI-related stocks drove the rally.
In the local equity market, the small-cap index produced a return of 3.5%, while the Top 40 index managed only a modest gain of 1.6%. The mid-cap index trailed with a return of 0.9%. Resources (-2.3%) continued to suffer losses in April. Financials and industrials, on the other hand, were up during the month, with returns of 4.2% and 3.2%, respectively.
South African government bonds rallied during the month, just enough to return to where they started the year. Gold finished the month broadly flat, while oil remained volatile around USD 100 per barrel.
All that glitters isn’t gold
“There’s no business like show business1”
- Irving Berlin
Few studio assets in Los Angeles carry the cultural weight of the Radford Studio Center, originally developed in the late 1920s as a silent film lot and
later known as CBS Studio Center. Located in Studio City (a neighbourhood effectively named after it), the property has been at the heart of American television production for decades. Iconic shows such as Seinfeld, Gunsmoke, The Mary Tyler Moore Show and Gilligan’s Island were all filmed on-site, cementing its status as one of Hollywood’s most storied production campuses. Over time, the 100 000 square meters (10 hectares, or 20 rugby fields) site evolved into a full-service studio complex, comprising soundstages, permanent sets, office space and production facilities that made it a cornerstone of the Los Angeles entertainment ecosystem. This deep heritage underpinned its record-breaking USD 1.85 billion acquisition in 2021 by Hackman Capital Partners, at the height of the streaming boom.
At the time, surging demand for content from platforms such as Netflix, Amazon and Disney drove intense competition for studio space, with investors underwriting strong rental growth and near-full utilisation. The transaction set a new benchmark for Los Angeles studio assets and even rivalled the largest office deals nationally, reflecting a market conviction that production infrastructure would remain structurally undersupplied. In short – it was all the rage, with investors looking for “the next hot deal”.
Hackman Capital Partners and its partners promoted the deal as a landmark transaction, emphasizing heritage, scarcity of production space, and streaming‑era demand.
Marketing and promotional coverage highlighted the site’s cultural legacy, redevelopment plans, and strategic fit within Hackman’s growing studio portfolio. The site was
even described as “irreplaceable.” All of these sound like perfectly valid reasons to go all in. Until they are not.
That thesis has since been challenged by a sharp reversal in industry fundamentals. The Hollywood writers’ and actors’ strikes in 2023 brought production to a standstill, while broader consolidation across media companies led to tighter content budgets and a more disciplined approach to spending. At the same time, major tenants such as Paramount (formerly CBS) reduced their footprint at the site, contributing to a decline in occupancy to around 60%. The combination of weaker demand, lower utilisation and a structural reset in the economics of television entertainment has materially impaired income expectations, exposing the vulnerability of assets acquired while it was the talk of the town.
The consequences have been stark. Hackman Capital ultimately defaulted on approximately USD 1.1 billion of debt secured against the property after multiple extensions,
forcing a lender group led by Goldman Sachs, alongside Wells Fargo and Morgan Stanley, to take control. The asset is now up for sale, with indicative bids reportedly in the
region of USD 400–450 million, implying a decline of around 75% from its 2021 valuation. This level of value destruction is extraordinary for a prime Los Angeles asset and highlights the degree to which capital values in certain “sexy” real estate sectors remain exposed to cyclical demand shocks and shifting structural trends.
The difference between the 2026 reality check of the 2021 deal description is stark. In five years, equity investors were wiped out, and lenders lost more than half their capital. If the USD 1.85 billion was invested in the S&P500 (very much not a “sexy” investment at the time, shortly after COVID-19) on 1 December 2021 it would have been worth USD 3.1 billion on 30 April 2026. A not too shabby return of over 10% per annum.
The Latin phrase “caveat emptor” comes to mind – let the buyer beware. Or at the very least, partner with a trusted adviser that has seen this movie before2.
1 The expression “there is no business like show business” originates from the 1946 Irving Berlin song There’s No Business Like Show Business, written for the Broadway musical Annie Get Your Gun. It quickly became a cultural catchphrase, popularized by Ethel Merman’s performances and later immortalized in the 1954 film of the same name.
2 The basis of this article from the “Property of the month” in the March 2026 newsletter of Clearance Capital (https://www.realestatealternatives.com/)
Disclaimer
The information provided is of a general nature only and does not take into account investor’s objectives, financial situations or needs. The information does not constitute financial product advice and it should not be used, relied upon or treated as a substitute for specific, professional advice. It is, therefore, recommended that investors obtain the appropriate legal, tax, investment and/or other professional advice and formulate an investment strategy that would suit the investor’s risk profile prior to acting on such information and to consider whether any recommendation is appropriate considering the investor’s own objectives and particular needs. Although the information provided and statements of fact are obtained from sources that Analytics Consulting considers reliable, we do not guarantee their accuracy, completeness or currency and any such information may be incomplete or condensed. No guarantee of investment performance should be inferred from any of the information contained in this document. Collective Investment Schemes in Securities (“CIS”) are generally medium to long term investments. The value of participatory interests may go down as well as up and past performance is not necessarily a guide to future performance.
Any opinions, statements and information made available, whether written, oral or implied are expressed in good faith. Views are subject to change, without prior notice, on the basis of additional or new research, new facts or developments. All data is in base currency terms unless otherwise indicated, and sourced as disclosed.