

Monthly Market Overview – June 2026
July 15, 2026Monthly Market Overview – August 2026
September 11, 2026Monthly Market Overview – June 2026
July 15, 2026Monthly Market Overview – August 2026
September 11, 2026NEWS
Monthly Market Overview
JULY 2026 IN REVIEW
ECONOMIC AND MARKET OVERVIEW
Renewed tensions between the United States and Iran dominated global headlines. Concerns over shipping through the Strait of Hormuz resulted in continued volatility in oil markets and heightened concerns about the vulnerability of global supply chains and energy security. Although tensions eased somewhat later in the month, the region remains a significant source of geopolitical risk.
The US Federal Reserve left interest rates unchanged at 3.50% to 3.75%. However, policymakers adopted a more hawkish tone than markets had anticipated, leading
investors to reduce expectations for near-term rate cuts and reinforcing the view that rates may remain higher for longer.
In a somewhat unexpected move, the South African Reserve Bank also left the repo rate unchanged during July. While inflation remains broadly contained, the Bank highlighted ongoing risks from global uncertainty, energy prices, and exchange-rate movements, opting for a cautious approach to monetary policy. South Africa continues to face structural economic challenges, including weak growth, infrastructure constraints, and fiscal pressures. Nevertheless, the country continues to benefit from a considerably more stable electricity environment than that experienced during the peak years of load shedding.
The European Central Bank continued to prioritise inflation control despite subdued economic growth across much of the Eurozone. Policymakers remain focused on balancing slower growth with the need to maintain price stability.
Japan continued its gradual exit from decades of ultra-accommodative monetary policy. The Bank of Japan's policy rate now stands at its highest level since the 1990s, reflecting growing confidence in the sustainability of inflation and wage growth.
Global economic forecasts remain fragile. While the moderation in oil prices from their June peaks has provided some relief, economists continue to warn that geopolitical risks, elevated debt levels, and sluggish trade growth could constrain economic activity in the years ahead.
Artificial intelligence (AI) remained a dominant investment theme during the month. However, investors became increasingly selective as questions emerged about whether the substantial capital expenditure being directed towards AI infrastructure is generating sufficient returns for shareholders.
MARKET PERFORMANCE
Global equity markets delivered a mixed performance during July, as investors weighed resilient economic activity against heightened geopolitical tensions and
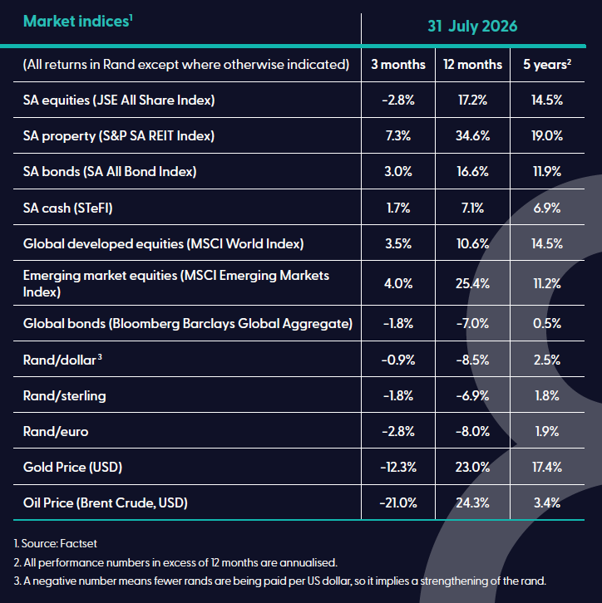
changing interest-rate expectations. In the United States, the S&P 500 ended the month virtually unchanged, declining by 0.1%, while the technology-heavy Nasdaq 100 fell 6.6% as investors took profits in several of the market's leading AI-related shares. The Dow Jones Industrial Average gained 0.3%, supported by stronger performance from financial, industrial, and energy companies.
European markets generally produced positive returns despite a challenging economic backdrop. The FTSE 100 in the United Kingdom gained approximately 3.6%, supported by the strength of resource and energy shares. Continental European markets were also broadly positive, as investors focused on moderating inflation and stable corporate earnings.
South African assets came under pressure during the month but ended in the green. The JSE All Share Index added a little over 1%. Local bonds gave up 1.4%, while the rand remained sensitive to changing global interest-rate expectations and developments in energy markets. Looking ahead, investors are likely to remain focused on inflation trends, central-bank policy decisions, and geopolitical developments, all of which continue to influence investment markets around the world.
The Big Mac Index at 40: The World's Most Famous Economic Joke
"Few investment tools have survived forty years, dozens of currency crises, and countless diet trends." - Unknown
In 1986, The Economist introduced what was intended to be a light-hearted illustration of a serious economic concept. Forty years later, the Big Mac Index has become one of the most widely recognised measures in global finance, appearing in economics textbooks, academic studies, and countless investment presentations. What began as a clever magazine graphic has evolved into a surprisingly useful tool for understanding currencies and purchasing power.
For most of us who are not economists, the enduring appeal of the Big Mac Index lies in its simplicity: instead of comparing thousands of goods and services across countries, it asks a single question:
How much does a Big Mac cost?
The Big Mac Index is based on the economic concept of Purchasing Power Parity (PPP). PPP suggests that, over the long run, exchange rates should adjust so that identical goods cost roughly the same around the world. If a basket of goods costs significantly more in one country than another, exchange rates should eventually move to narrow the gap. The Economist's innovation was to replace a complicated basket of goods with a single product that is sold globally.
A Big Mac was chosen because:
• It is sold in dozens of countries.
• The product is relatively standardised.
• Its price incorporates a broad range of local costs, including labour, rent, ingredients, transportation, marketing, and taxes.
For example, if a Big Mac costs $6.22 in the United States but the equivalent of only $2.42 in Taiwan, the index suggests that the Taiwanese dollar may be undervalued relative to the US dollar.
The index was created by Pam Woodall, then an editor at The Economist, and first appeared in September 1986. Woodall reportedly described the idea as a "bathtub moment", an instance of inspiration that struck while she was contemplating how to explain exchange-rate theory in a more accessible way.
The concept resonated immediately because it translated an abstract economic theory into something readers could literally hold in their hands. As The Economist later admitted, "burgernomics" was never intended to be a rigorous valuation model. It was simply a way to make exchange-rate theory more digestible. The popularity of the Big Mac Index rests on three key strengths.
1. It Makes Economics Understandable
Most people struggle to relate to discussions about effective exchange rates, inflation differentials, or purchasing power parity. Almost everyone, however, understands the price of a hamburger. The index transformed a complex economic concept into a conversation that could take place around a dinner table rather than in a university lecture hall.
2. It Uses Real-World Data
Unlike theoretical models, the Big Mac Index relies on actual prices paid by consumers. A Big Mac's price reflects local economic conditions, including wages, rents, taxes, and operating costs. In this sense, it captures something tangible about the purchasing power of a currency.
3. It Has Often Been Surprisingly Insightful
Although simplistic, the index has frequently highlighted currencies that appeared materially overvalued or undervalued. Over long periods, several currencies identified as significantly mispriced by the index have eventually moved closer to their implied PPP values, even if the timing was impossible to predict.
As entertaining as the Big Mac Index is, it should not be mistaken for a forecasting tool. One major weakness is that Big Macs are largely produced and consumed locally. Unlike gold, oil, or semiconductors, hamburgers cannot easily be arbitraged across borders. Nobody is shipping frozen Big Macs from Indonesia to Switzerland to profit from price differences.
Another factor that influences its value as an economic tool is that a large portion of a Big Mac's cost comes from labour and rent. Countries with lower wages naturally tend to have cheaper burgers. This means a cheap Big Mac may tell us as much about a country's income levels as it does about its currency valuation. Recognising this criticism, The Economist later introduced a GDP-adjusted Big Mac Index, which attempts to account for differences in income levels between countries.
Consumer preferences also differ. A Big Mac is not equally popular everywhere. Taxes, regulations, competition, local tastes, and market positioning can all affect pricing independently of exchange rates. In some countries, McDonald's is a mainstream fast-food option; in others, it is closer to a premium dining experience.
Perhaps the biggest lesson for investors is that currencies can remain apparently overvalued or undervalued for a very long time. Even if a currency appears 30% undervalued according to burgernomics, that does not mean it will appreciate soon, or at all. Capital flows, interest rates, politics, and investor sentiment often dominate in the short and medium term. In fact, according to the Big Mac Index, the rand has been undervalued against the US dollar for at least the last 26 years, as The Economist shows below.

Source: McDonald's; LSEG Workspace; IMF; Eurostat; LebaneseLira.org; Banque du Liban; The Economist
This "economic joke" has led to several interesting developments over the last 40 years:
• The Economist Created an Entirely New Word
The success of the index gave rise to the term "burgernomics", now a recognised shorthand for using everyday products to explain economic concepts.
• It Spawned Countless Imitators
Over the years, economists and journalists have attempted similar indices using Starbucks lattes, Apple iPhones, and even IKEA bookshelves. None achieved the global recognition or longevity of the Big Mac Index.
• Switzerland Is Almost Always Expensive
One of the most persistent findings over four decades has been the apparent overvaluation of the Swiss franc. In the 2026 edition, a Swiss Big Mac cost the equivalent of roughly $9.04, making it one of the most expensive burgers in the world.
• The Cheapest Burgers Are Usually Found in Asia
The 2026 rankings showed Indonesia and Taiwan among the cheapest places to buy a Big Mac after conversion into US dollars, highlighting the substantial gap in purchasing power across countries.
Perhaps the greatest irony is that a feature originally designed as a semi-humorous magazine graphic has become the subject of dozens of academic papers and is now routinely cited in economics textbooks. It is, however, best viewed as a starting point rather than a conclusion.
It reminds investors that currencies ultimately derive their value from what they can buy in the real world. It also highlights how market exchange rates can diverge dramatically from underlying purchasing power for extended periods.
Forty years after its creation, the index remains relevant not because it predicts currency movements, but because it illustrates a timeless investment lesson: price and value are not always the same thing. Whether one is evaluating a currency, a share, or a hamburger, understanding that distinction remains one of the foundations of successful investing.
You would have worked up quite an appetite after reading all of this; perhaps it's time for that Big Mac now?
Disclaimer
The information provided is of a general nature only and does not take into account investor’s objectives, financial situations or needs. The information does not constitute financial product advice and it should not be used, relied upon or treated as a substitute for specific, professional advice. It is, therefore, recommended that investors obtain the appropriate legal, tax, investment and/or other professional advice and formulate an investment strategy that would suit the investor’s risk profile prior to acting on such information and to consider whether any recommendation is appropriate considering the investor’s own objectives and particular needs. Although the information provided and statements of fact are obtained from sources that Analytics Consulting considers reliable, we do not guarantee their accuracy, completeness or currency and any such information may be incomplete or condensed. No guarantee of investment performance should be inferred from any of the information contained in this document. Collective Investment Schemes in Securities (“CIS”) are generally medium to long term investments. The value of participatory interests may go down as well as up and past performance is not necessarily a guide to future performance.
Any opinions, statements and information made available, whether written, oral or implied are expressed in good faith. Views are subject to change, without prior notice, on the basis of additional or new research, new facts or developments. All data is in base currency terms unless otherwise indicated, and sourced as disclosed.